background
crossovers
impedance
objective
simulation
amp output
burn in
biWire
biWire bridging
ac wiring
mains voltage
Copyright © 1998-2025
ieLogical
All Rights Reserved

Cable Snake Oil Antidote
... change everything, make no difference / change nothing, make a difference ... Really?
Background
Contention
For decades controversy has raged in HiFi audio as to the variability of electronics and cables. Most could agree that loudspeakers sound different. Many could not agree that elements of a HiFi system that amplify and conduct the energy which makes the speakers move could sound different.
The inestimable Nelson Pass wrote an illuminating paper in 1980: SPEAKER CABLES: Science or Snake Oil.
In 1995, Stereophile published an article What a Difference a Wire Makes stating “Many manufacturers, particularly in the US, hide their apparent ignorance about what they're making behind impressive-sounding but almost meaningless phrases like 'time-compensated' (try delay-compensated), 'phase noise', and 'phase coherence') ... Many makers evidently just copy. No doubt their products can sound better in particular ways and in particular instances, but the real innovators are few; those who really have a handle on what they're doing are even fewer.”
In the ensuing ½ century, little has changed.
Loudspeaker crossovers are constructed with Inductors [L], Capacitors [C] and Resistors [R] to shape the energy to match divers drivers and the cabinet for the desired response. LCR combine to form Impedance [Z]. For more information, Wikipedia has excellent pages on Inductance, Capacitance, Resistance and Impedance. Impedance is frequency dependent and thus varies across the audio band.
It is counter intuitive that electrical energy in a series of electronics, cables and transducers could be immune from changes in LCR. Given loudspeakers with sufficient resolution, the changes should be apparent. However, just as some are colorblind and others tone deaf, some do not have the ability to discern differences others might consider glaring.
Amplifier outputs and cables all have LCR properties. When one chains together LCR components, frequency and phase response alter. Certain combinations of LCR become resonant at some frequencies. Loudspeaker XOvers are Tone Controls to contour the audio for each driver. Since LCR are cable properties cables are also Tone Controls, albeit at a much reduced level. An electronics engineer knows what is driving and following his Tone Control circuit and can thus tailor it for precise control. No such luck for a cable manufacturer. A cable's performance is system dependent. An arguably better cable could make a system less pleasant if it exposes existing flaws or interacts negatively with driver or load.
PS Audio Copper Magazine has an excellent series of articles on audio cables by Garen Galeis of Belden. The Belden cables are marketed under the Iconoclast label and sold by Blue Jeans Cable.
Time is of the Essence Part 1 Time is of the Essence Part 2 Time is of the Essence Part 3
XLR Interconnect Design Speaker Cable Design, Part 1 Speaker Cable Design, Part 2
Time is of the Essence Part 1 Time is of the Essence Part 2 Time is of the Essence Part 3
XLR Interconnect Design Speaker Cable Design, Part 1 Speaker Cable Design, Part 2
Crossovers, Frequency and Phase
Crossovers are built with LCR and alter both the amplitude and phase of the signal. The designer may use multiple sections to adjust the slope [rate] in different bands to compensate for driver anomalies. As slope increases, so does phase shift and group delay. Unfortunately, very few loudspeakers are minimum possible phase error and thus a great many have never heard such a system. For those who appreciate what phase coherence accomplishes, non-aligned loudspeakers can have artifacts that make them less than ideal.
Humans localize sound from several cues including time- and level-differences between both ears. With a naturally occurring sound directly in front of the listener the fundamental and harmonics arrive in each ear at the same time. Humans are most sensitive to (i.e. able to discern at lowest intensity) frequencies between 2KHz and 5Hz. Most music has little content above 8KHz.
With a 2nd order 440Hz crossover [12db/oct] the 2nd harmonic of A440 is shifted a few hundred µS or inches relative to the fundamental. As cables have LCR properties, they also alter the amplitude, phase and delay. Whether these changes enhance or detract is completely system dependent! What works well in one system may not in another.
Impedance
Inductors and Capacitors change the phase relationship between the voltage and current of an AC signal. Taken together with Resistance, they form Impedance. In the ubiquitous 75Ω CATV RG-6, 75Ω refers to its Impedance, not resistance.
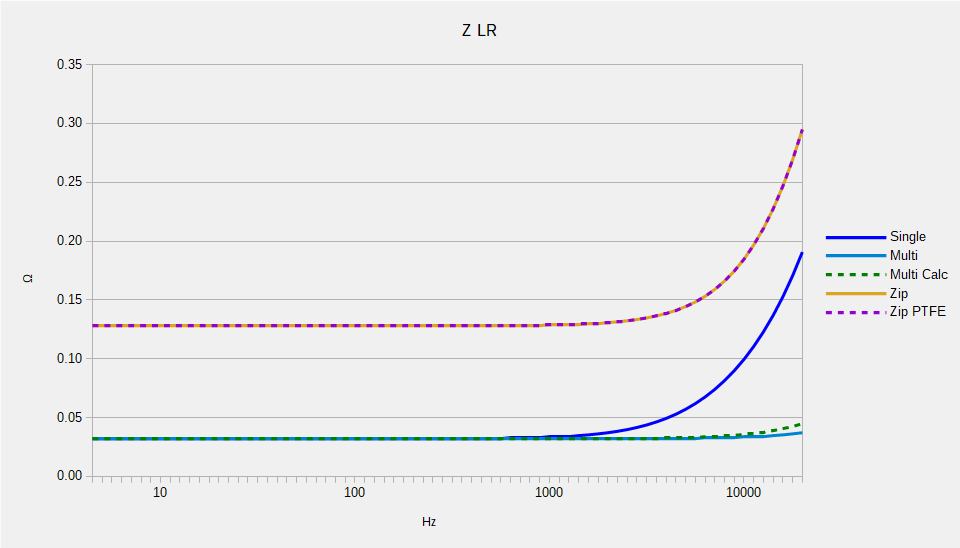
In general, loudspeaker cables should strive to minimize L as it has the most impact at audio frequencies and loudspeaker impedances.
In general, loudspeaker cables should strive to minimize L as it has the most impact at audio frequencies and loudspeaker impedances.
Click thumbnails for a larger image
This graph shows the relative impedances of the cables used in the simulations. The Multi cables are ribbon cable wired as alternating Signal+/Signal–* parallel cables. Note how the impedance of these multiple cables is flatter than typical 'speaker wire' or 'zip cord'. Geometry has everything to do with Impedance and just because a cable is flat, it does not necessarily mean better.
* Signal– is preferable to Ground as Earth Ground it may not be. Misuse of the term Ground leads to all manner of confusion in audio. The same current flows in Signal– as Signal+ but in the opposite direction.
* Signal– is preferable to Ground as Earth Ground it may not be. Misuse of the term Ground leads to all manner of confusion in audio. The same current flows in Signal– as Signal+ but in the opposite direction.
Objective
HiFi is extremely personal and one man's meat is another's poison. Some like it very loud with lots of bass and others cherish the silky treble and apparent sound stage of tube electronics. Others prize Time Coherence and accurate phase response. Still others have no problem listening to distorted Lossy Encoding on portable devices. Others cannot abide Lossy Encoding in any form. See why Lossy Encoding sounds bad for more information.
In absolute terms, HiFi should be indistinguishable from a live performance meaning that all localization clues are accurately reproduced. Our objective is to show how cables affect those cues and that cables interact with both the driving and driven end.
In absolute terms, HiFi should be indistinguishable from a live performance meaning that all localization clues are accurately reproduced. Our objective is to show how cables affect those cues and that cables interact with both the driving and driven end.
Caveats
There are many additional parameters that are not included in the models and simulation. Dielectric, skin & proximity effects, voice coil temperature, loudspeaker connector LCR, loudspeaker internal wiring LCR, XOver PCB LCR, etc. Most of these are small in relation to variances due cable LCR. Others only become operative at the very top of the audio band. A 3-way system will have response variations in completely different areas. A cable that works well with a 2-way system may not on a 3-way. A cable that works well on a complex loudspeaker Z and a tube amp may not on a flatter Z and a solid state amplifier. There is no free lunch!
Cables have different effects in different systems. The only true way to know if a cable is better is to try it in YOUR system. Another listener may totally disagree as they prefer alternate colorations. Audio store demos are not always valid for your system. Cables that are initially impressive can wear thin very quickly. When auditioning any component, always replug ALL connections, both power and signal, in the whole system. Listen to your reference materials on a fully warmed system. See Winter Blues for possible thermal effects. Auditory memory is notoriously poor, so comparisons should be as contemporaneous as possible. Consuming relaxants can have severely deleterious effects on auditory acuity.
Cables have different effects in different systems. The only true way to know if a cable is better is to try it in YOUR system. Another listener may totally disagree as they prefer alternate colorations. Audio store demos are not always valid for your system. Cables that are initially impressive can wear thin very quickly. When auditioning any component, always replug ALL connections, both power and signal, in the whole system. Listen to your reference materials on a fully warmed system. See Winter Blues for possible thermal effects. Auditory memory is notoriously poor, so comparisons should be as contemporaneous as possible. Consuming relaxants can have severely deleterious effects on auditory acuity.
Models
[Click Thumbnails for a larger image]
Amplifier

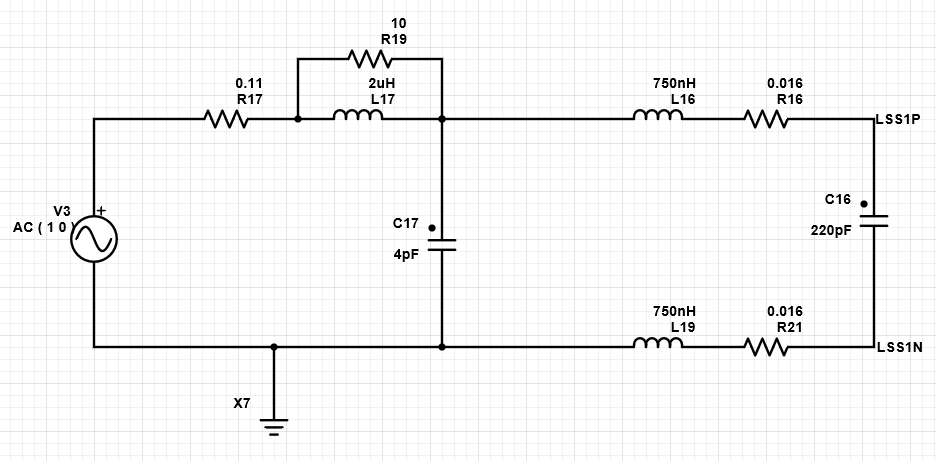
Solid State Amplifier output stage model is an idealized source configured with emitter resistor, output inductor with parallel resistor and output connector capacitance. It has no bandwidth limitation. An actual amplifier has bandwidth limitations and its implementation can affect response within the audio band when interacting with cable and loudspeaker Z.
Emitter Resistor - Each output transistor has an emitter resistor to stabilize its bias current. These resistors are typically on the order of about 0.22Ω. Small amplifiers may have one or two output transistors while large amplifiers may have more than a dozen. In the simulations we have used 0.11R for two output devices for an amplifier around 100W and 0.025 for an amplifier with eight output devices for an amplifier of around 400W. This output R reacts with the cable impedance.
Emitter Resistor - Each output transistor has an emitter resistor to stabilize its bias current. These resistors are typically on the order of about 0.22Ω. Small amplifiers may have one or two output transistors while large amplifiers may have more than a dozen. In the simulations we have used 0.11R for two output devices for an amplifier around 100W and 0.025 for an amplifier with eight output devices for an amplifier of around 400W. This output R reacts with the cable impedance.
Loudspeaker Cables

Loudspeaker Cables are modeled as single 2 conductor wire and a cable made of 10 pairs of parallel wires. Two types of single wire are modeled: a 12ga OFC commercial loudspeaker cable and 18ga zip cord. The Multiple wire cable is based on a 22ga ribbon configured as 10-way Signal± pairs. This equalizes R with the Single model. Note that Signal- may or may not be at earth potential and current flows in both conductors equally. LCR values are divided equally between the two conductors.
LCR values: Single: 12ga L 150nH/ft - C 22pF/ft - R 0.0016Ω/ft** - Polyolefin - Src: manufacturers data sheet Multi: 22ga L 150nH/ft* - C 11pF/ft* - R 0.016Ω/ft** - PVC - Src: manufacturers data sheet* Zip: 18ga L 212nH/ft - C 14.6pF/ft - R 0.0064Ω/ft** - PVC - Src: calculated from materials and geometry * - LC values based on Gnd-Signal-Gnd. Single 22ga Gnd-Signal calculated value is 250nH and 13pF
** - DC R values per conductor
Loudspeakers
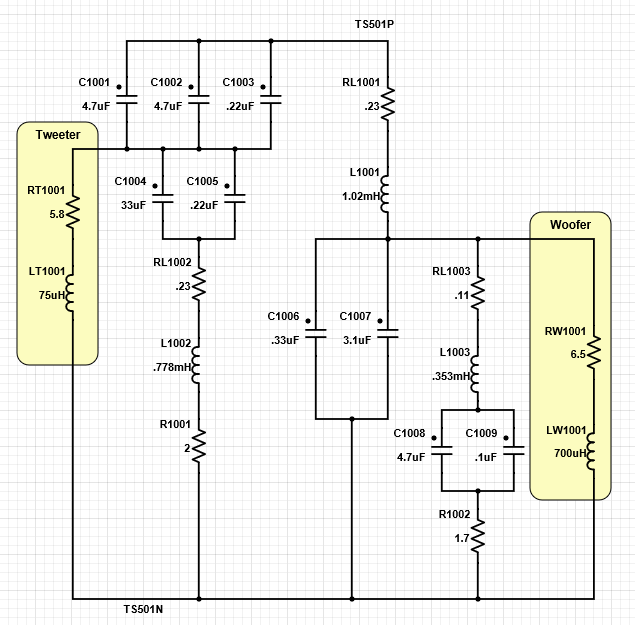
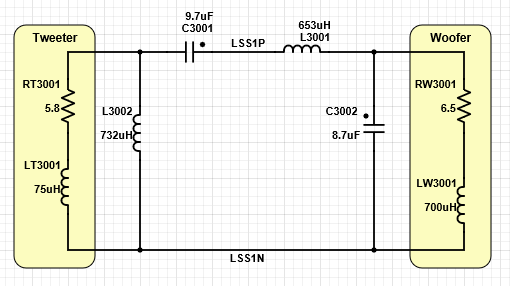
Loudspeakers are modeled as two way with 2KHz crossover. One uses a computer [Comp] model that incorporates driver impedance and performance. Missing from this model is the parallel C across inductors and drivers. The other uses a 'cookbook' [CkBk] 2nd order crossover calculated simply from the driver R values.
NOTE: Loudspeaker models ignore driver resonances or cabinet loading, as indicated by the simulation responses below 500Hz. This Google link for Loudspeaker Impedance Curves should disabuse even the most skeptical that their loudspeakers are a constant 8Ω.
Simulation Results
Response below 100Hz and above 20KHz are not plotted in the comparison graphs below for clarity. As can be seen from loudspeaker impedance curves, Z below 500Hz varies enormously. Modeling it is beyond this scope. Suffice it to say that interaction below 500Hz is far more significant than shown. Response above 20KHz could vary significantly with amplifier design. These examples are for illustration ONLY and are not intended for any other purpose.
Click thumbnails for a larger image
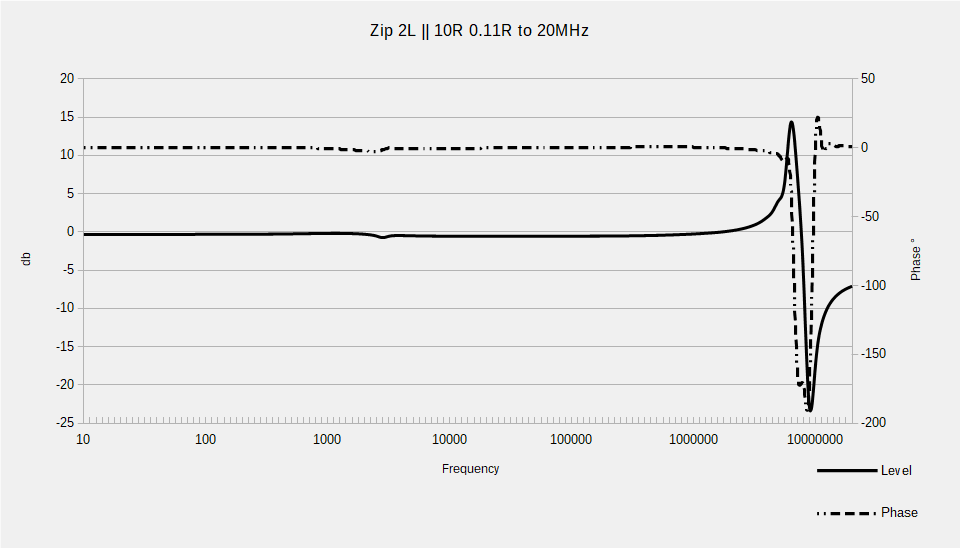
Simulation response to 20MHz
Simulation response to 20MHz
 Single 12ga Wire to Cookbook XOver Single 12ga Wire to Cookbook XOver
|
 Single 12ga Wire to Computer XOver Single 12ga Wire to Computer XOver |
|
 Multi 22ga Wire to Cookbook XOver Multi 22ga Wire to Cookbook XOver
|
 Multi 22ga Wire to Computer XOver Multi 22ga Wire to Computer XOver |
|
 Zip 18ga Wire to Cookbook XOver Zip 18ga Wire to Cookbook XOver
|
 Zip 18ga Wire to Computer XOver Zip 18ga Wire to Computer XOver |
|
 18ga Mylar Wire to Cookbook XOver 18ga Mylar Wire to Cookbook XOver
|
 18ga Mylar Wire to Computer XOver 18ga Mylar Wire to Computer XOver |
|
 Teflon Zip 18ga Wire to Cookbook XOver Teflon Zip 18ga Wire to Cookbook XOver
|
 Teflon Zip 18ga Wire to Computer XOver Teflon Zip 18ga Wire to Computer XOver |
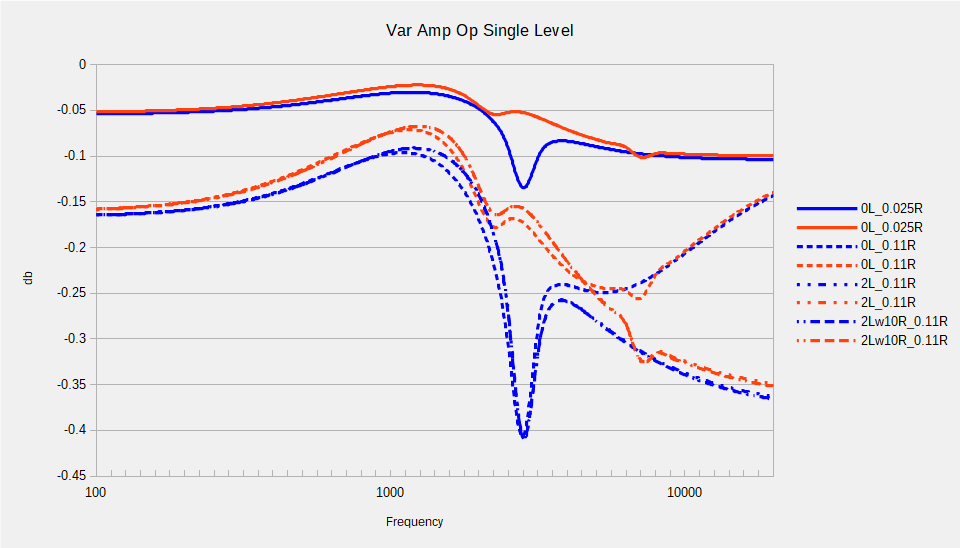
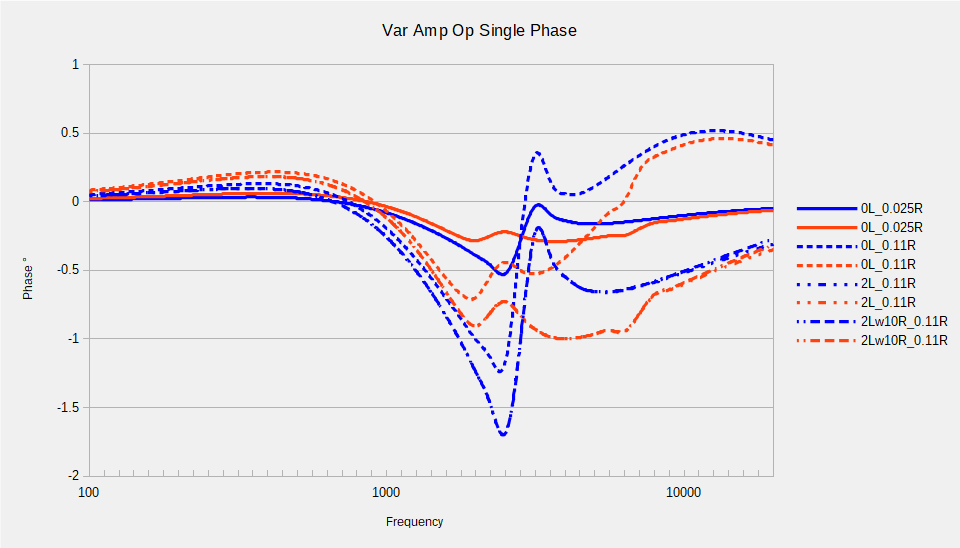
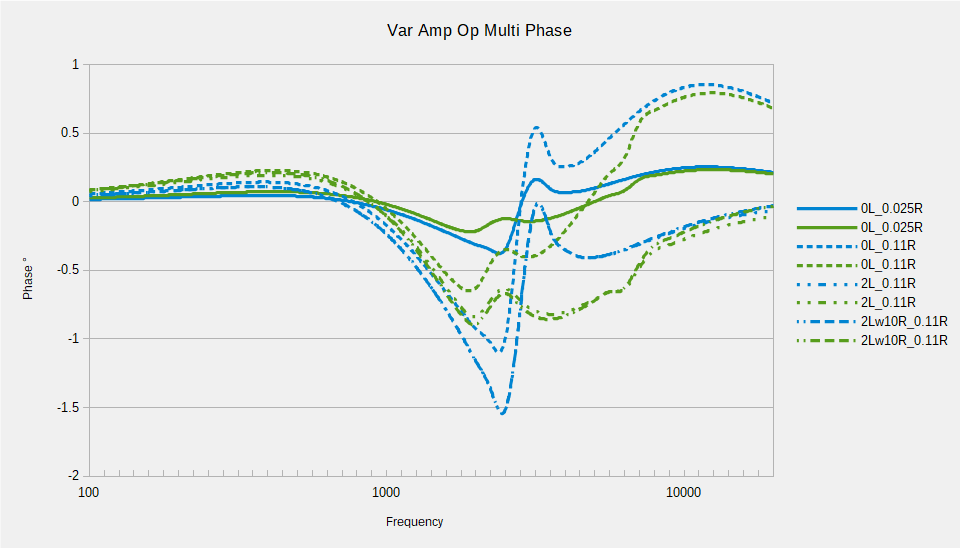
Amplifier Output R
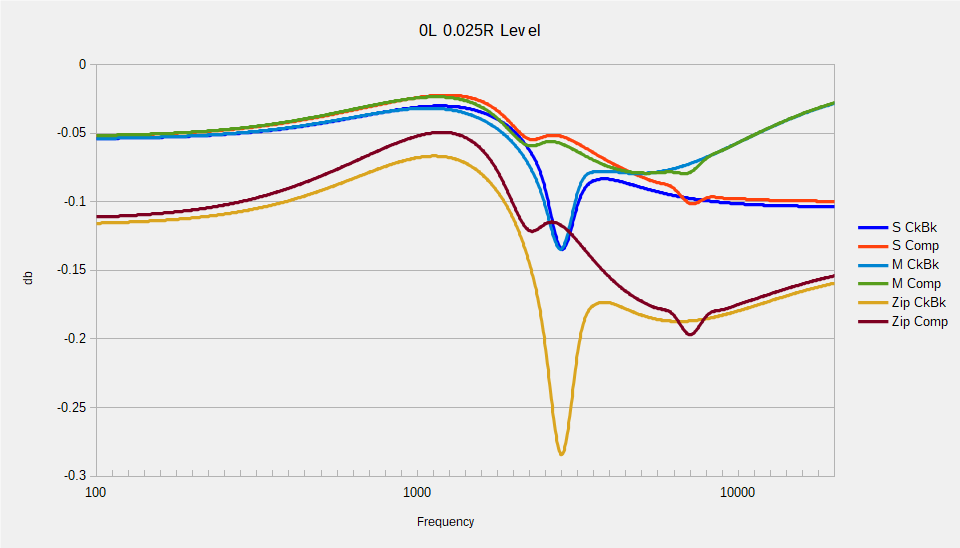
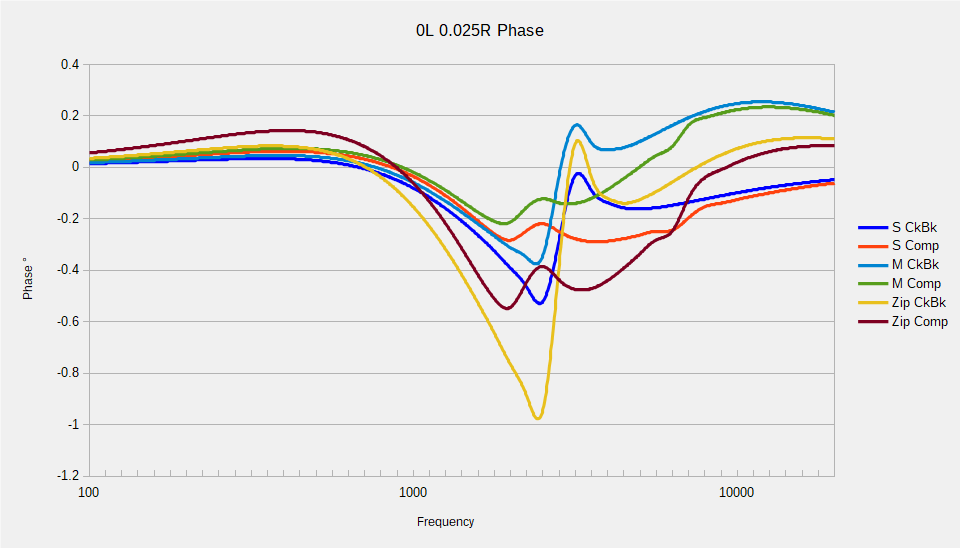
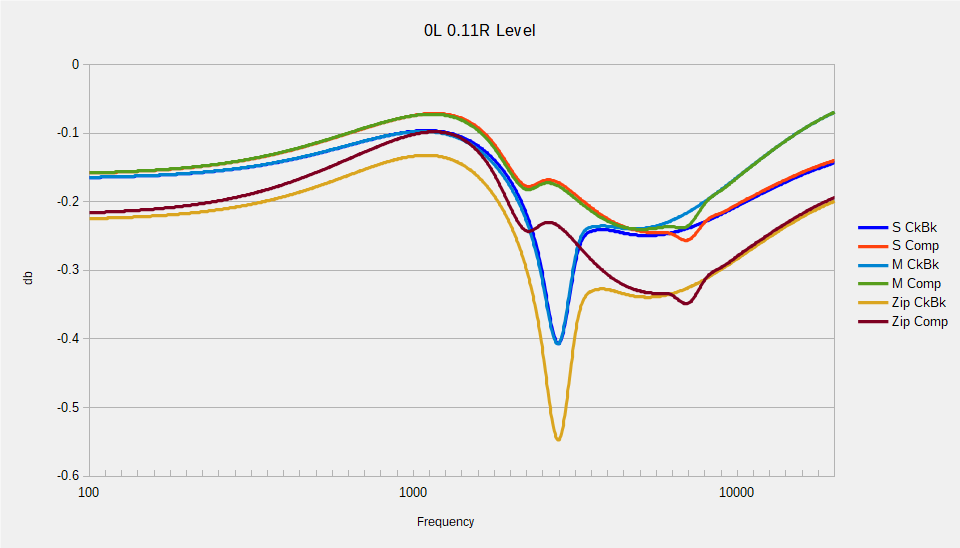
This simulation shows how the amplifier output R may interact with cable LCR and the loudspeaker Z. Notice the difference in the upper frequency slopes and how they interact with the different crossovers. This simulates the change that could be expected with identical amps differing only in number of output devices, all other things being equal.
Amplifier Output L and R
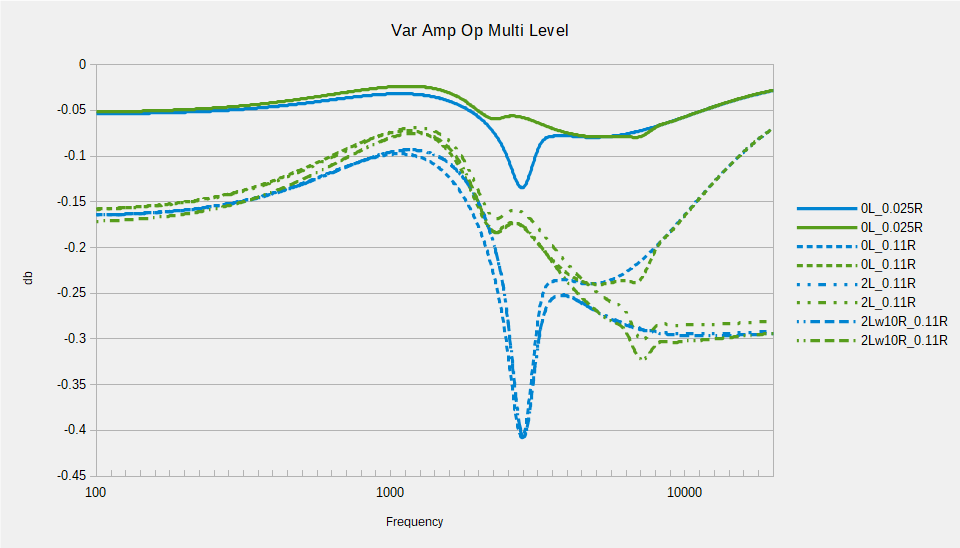
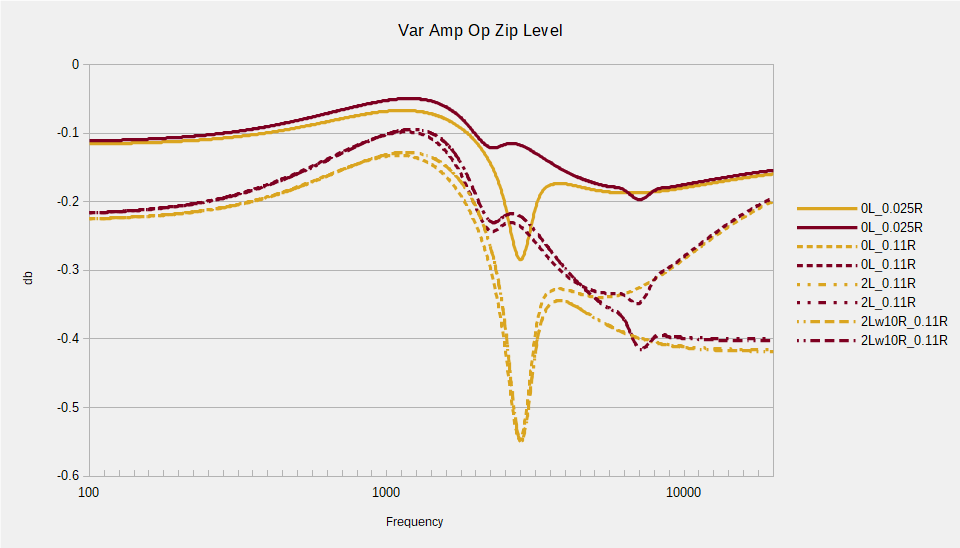
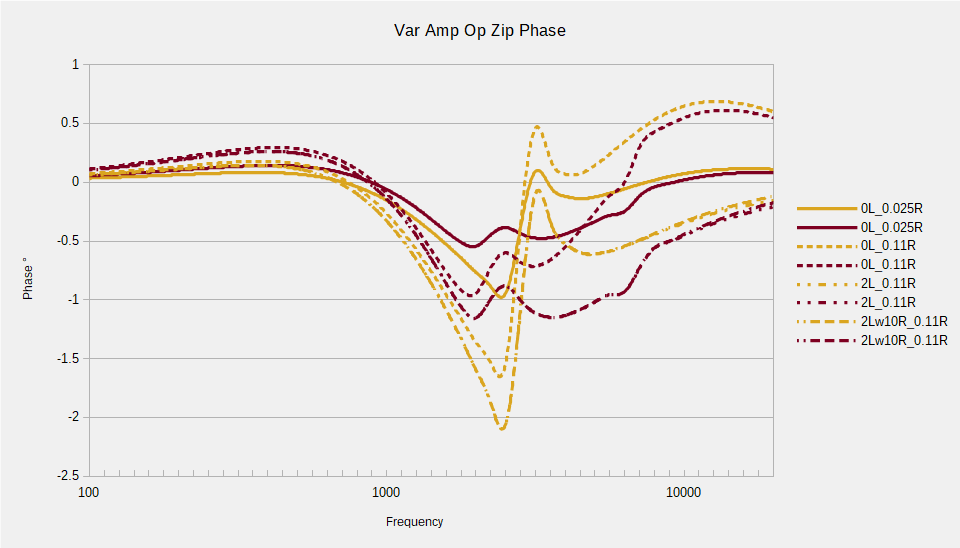
This simulation shows how the amplifier output L and R may interact with cable LCR and the loudspeaker Z. Notice the difference in the upper frequency slopes with the addition of the 2µH inductor. The parallel R has very little effect in the audio band but could help with a higher capacitance cable and low impedance loudspeaker in preventing parasitic oscillation.
The above two simulations give insight into an amplifier output property fault wherein the output Z is dynamically affected in a frequency-dependent manner as a function of output level. Loudspeaker impedance varies with frequency and to a lesser extent with input level. In the amplifier, as the output level and frequency vary, output impedance varies. Output transformers suffer badly in this area and contribute to the tube sound. OTL [Output TransformerLess] tube designs are an attempt to mitigate this problem trading power for fidelity. Solid state is not immune. Unless the power supply has sufficient reserve capacity, the output can be starved by large peaks at the loudspeaker Z minima. If the output Z is varying dynamically, its interaction with the cable is also varying dynamically in proportion to the cable's impedance. And thus, the loudspeaker is not fed an identically phased signal at -10db as at -9 or -11. This fault could render a store demo or another's opinion suspect even when conducted on identical equipment unless the listening and amplifier drive levels are matched. Room interactions play a significant part in the perceived sound and may ameliorate or exacerbate cable colorations.
The above two simulations give insight into an amplifier output property fault wherein the output Z is dynamically affected in a frequency-dependent manner as a function of output level. Loudspeaker impedance varies with frequency and to a lesser extent with input level. In the amplifier, as the output level and frequency vary, output impedance varies. Output transformers suffer badly in this area and contribute to the tube sound. OTL [Output TransformerLess] tube designs are an attempt to mitigate this problem trading power for fidelity. Solid state is not immune. Unless the power supply has sufficient reserve capacity, the output can be starved by large peaks at the loudspeaker Z minima. If the output Z is varying dynamically, its interaction with the cable is also varying dynamically in proportion to the cable's impedance. And thus, the loudspeaker is not fed an identically phased signal at -10db as at -9 or -11. This fault could render a store demo or another's opinion suspect even when conducted on identical equipment unless the listening and amplifier drive levels are matched. Room interactions play a significant part in the perceived sound and may ameliorate or exacerbate cable colorations.
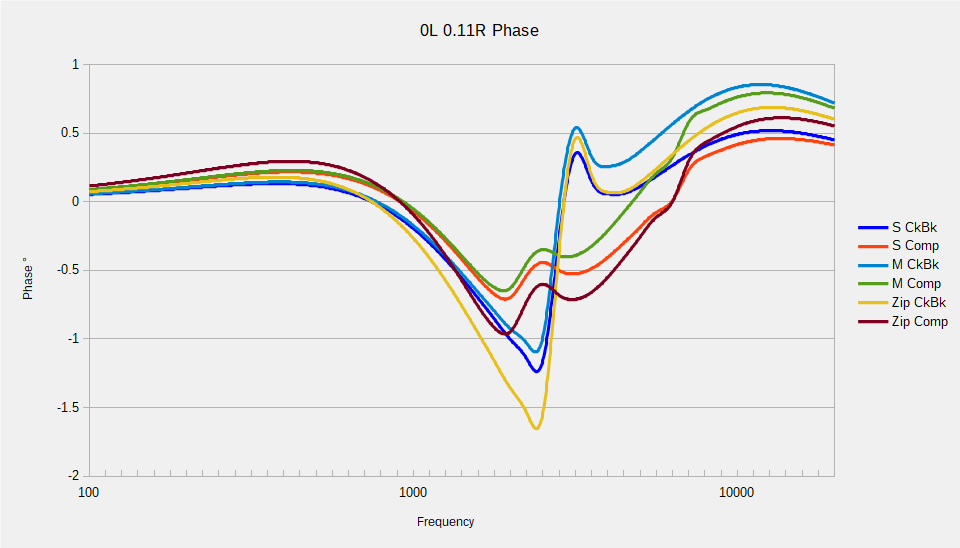
Cable Comparisons to Cookbook and Computer Optimized XOvers
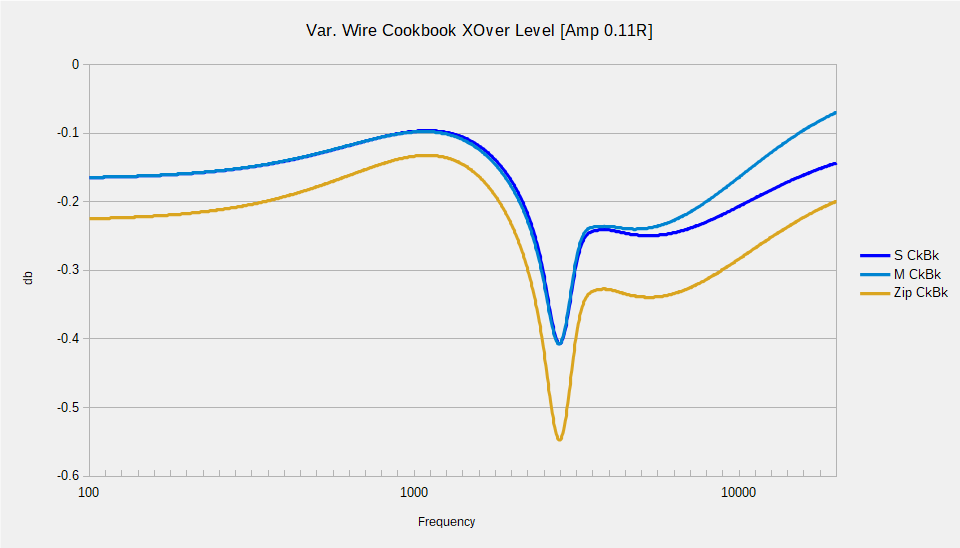
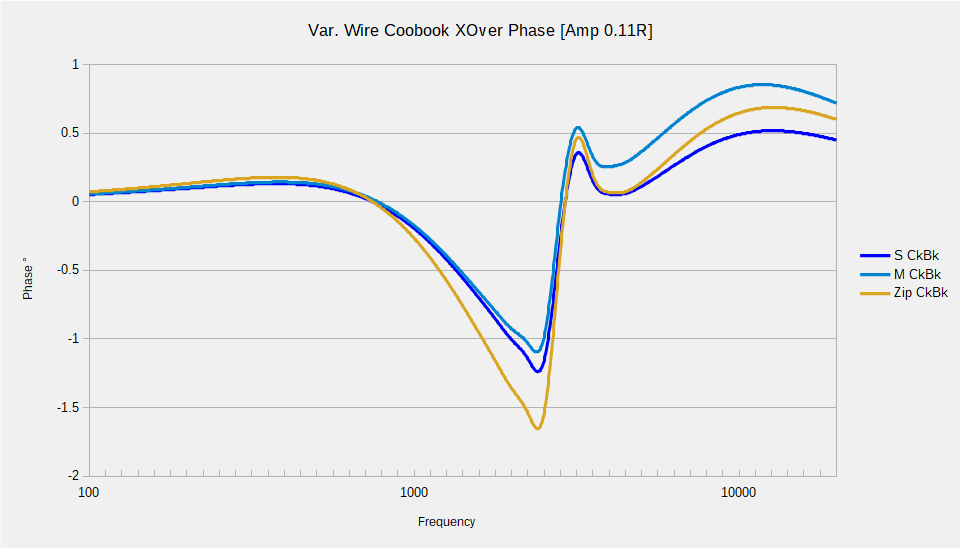
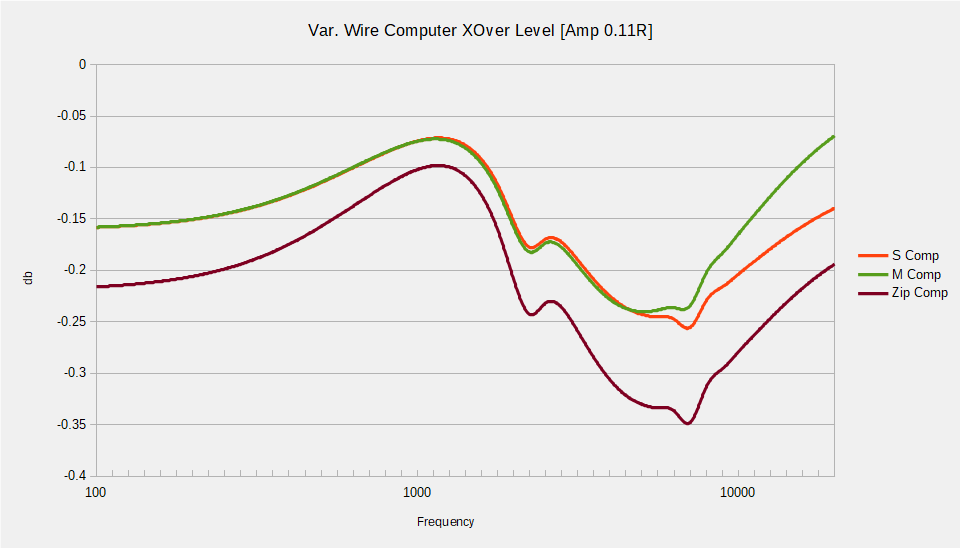
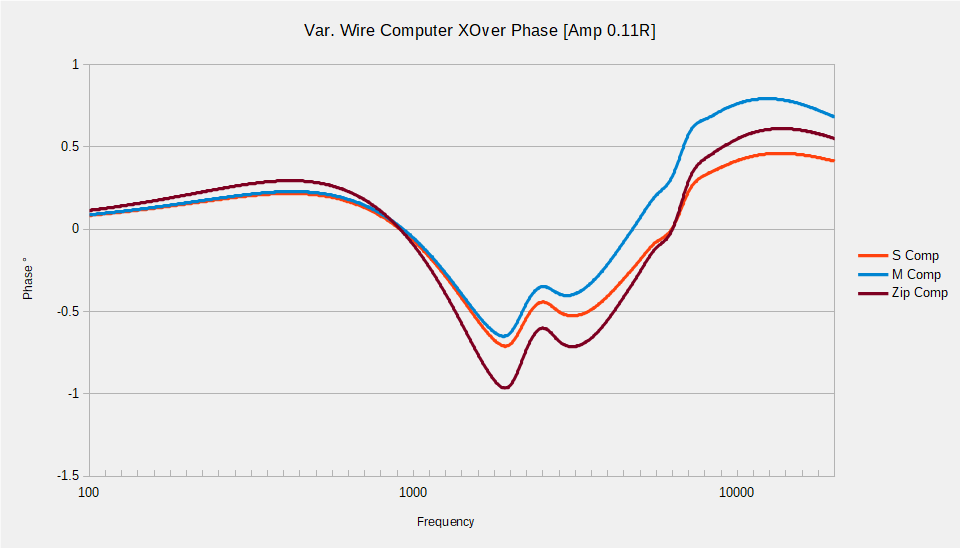
Level and Phase comparisons for Cables to Cookbook and Computer Optimized 2-way 2Khz XOvers.
Cable Comparisons with Single Parameter Change
LCR depends on wire diameter, wire spacing and dielectric material. LCR all increase linearly with cable length. Ignoring permeability, L depends on size and spacing. C depends on size, spacing and dielectric. It is not trivial to fabricate two physically different cables and achieve the same impedance.
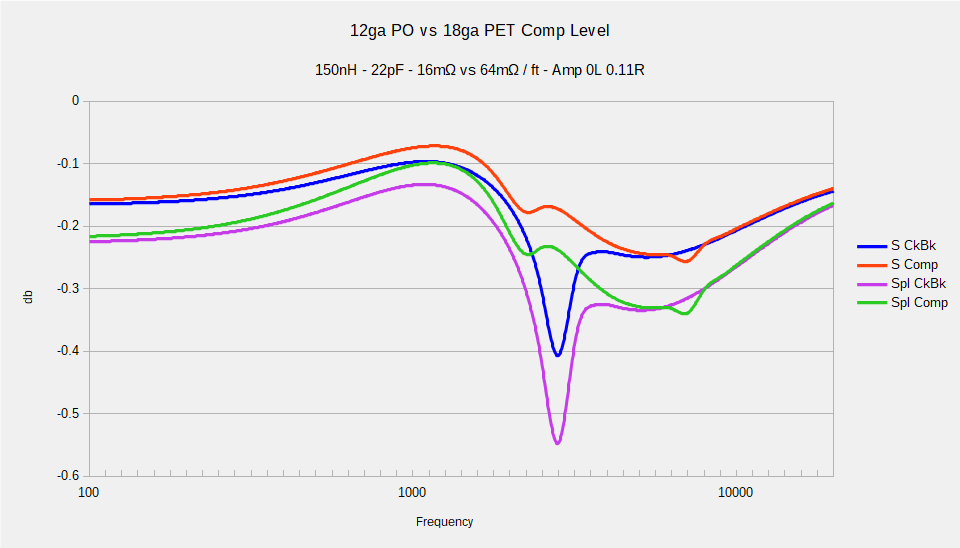
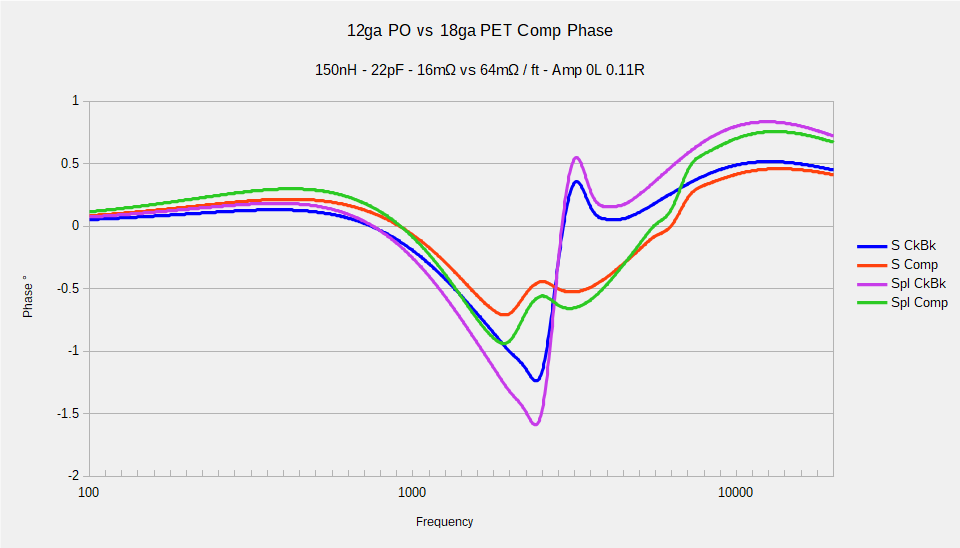
In this cable pair, diameter and spacing were adjusted to maintain L and dielectric changed from Polyolefin to Mylar to keep capacitance constant. R varies in this example, 18ga being 4x more resistive than 12ga.
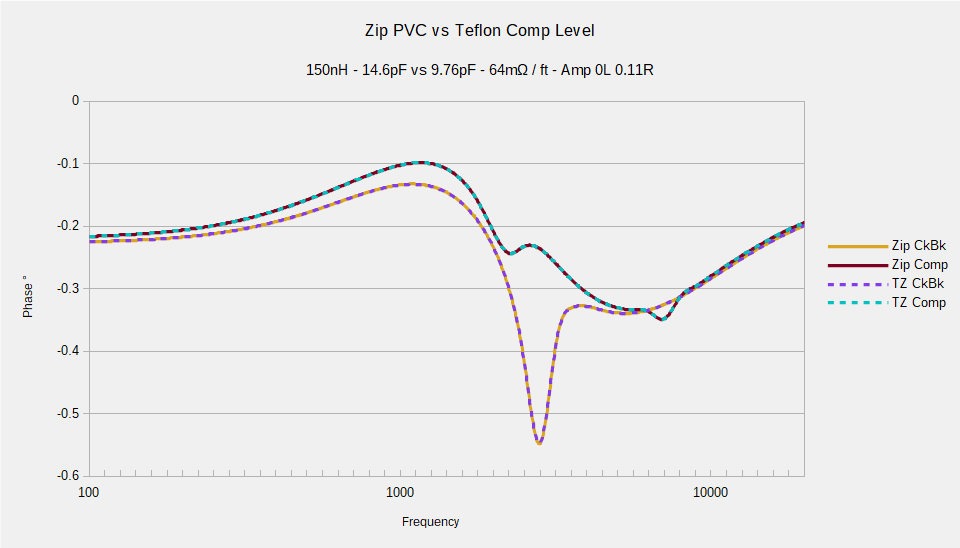
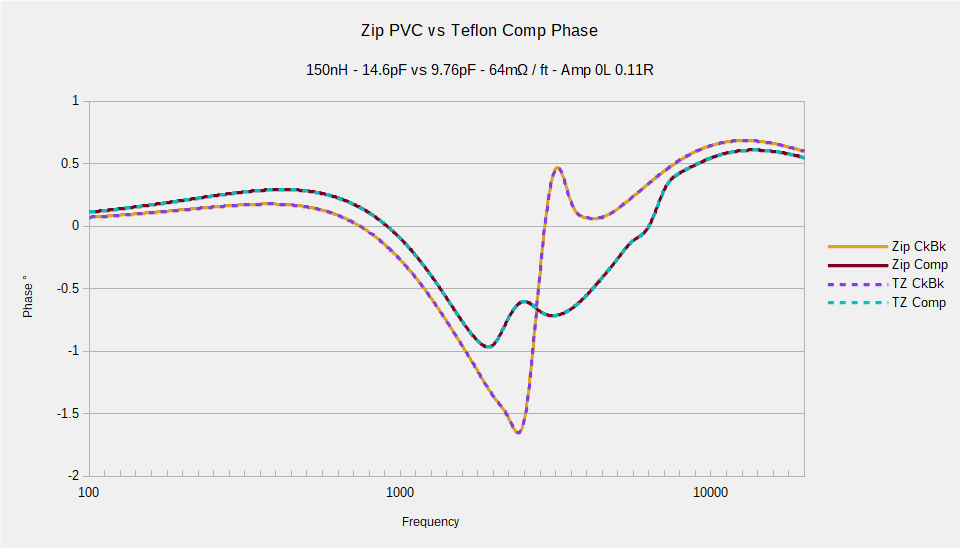
In this cable pair, diameter and spacing were maintained to keep L & R constant, and dielectric changed from PVC to Teflon. C drops from 14.59pF to 9.76pF / ft.
Note how the traces overlay, indicating very little difference.
Note how the traces overlay, indicating very little difference.
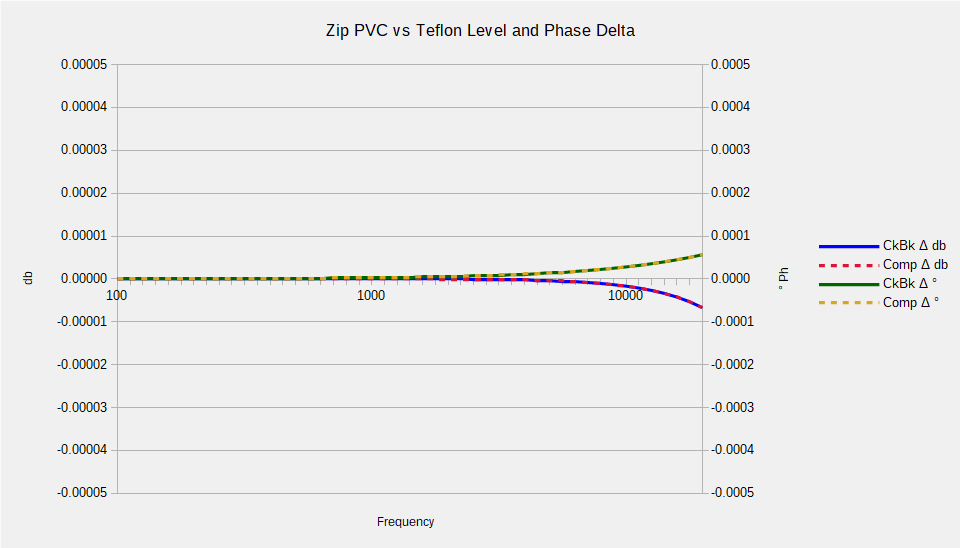
This graph of Level and Phase deltas show just how little difference there is between PVC and Teflon in the audio band for Zip cord geometry cables. Maximum Level is about 0.00005db and Phase about 0.0005° @ 20KHz! Nevertheless, some attribute dielectric with a significant sonic signature.


These graphs show how little difference there is between PVC and Teflon to 1MHz. Above 5MHz is where capacitive differences begins to tell. Teflon has a lower dielectric absorption factor which may improve smearing over PVC.
Cable Burn In
Cable Burn In is an outgrowth of evaluating cables [or anything for that matter] not in the system and room in which it will be used.
The poor schlub gets the item home, connects it to vastly different gear and rightly determines the sonics are worse. Hence, he's advised 100's hours are required to burn in. Poppycock! All that happens is the victim gets used to the change and convinces himself it got better. Meanwhile, the temperature, pressure, humidity, line voltage and CBLF frailties have changed. Burn In is BUNK!
ALL systems, both electronic and carbon based, change in response to environmental conditions. Familiarity breeds contempt and at some point the victim will confirm things truly have gotten better.
Bi-Wiring
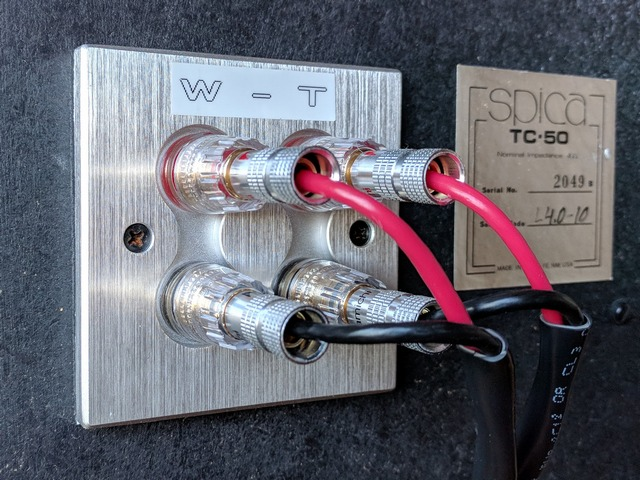
Bi-Wiring uses two cables to separate Woofer and Mid/Tweeter connectors on the speaker from a single amplifier output. Some claim that it makes an improvement and others say there is no benefit. Some critical listeners who can reliably detect cable differences also claim to detect Bi-Wiring. As always it will be system dependent and subject to listener bias as to better or not.
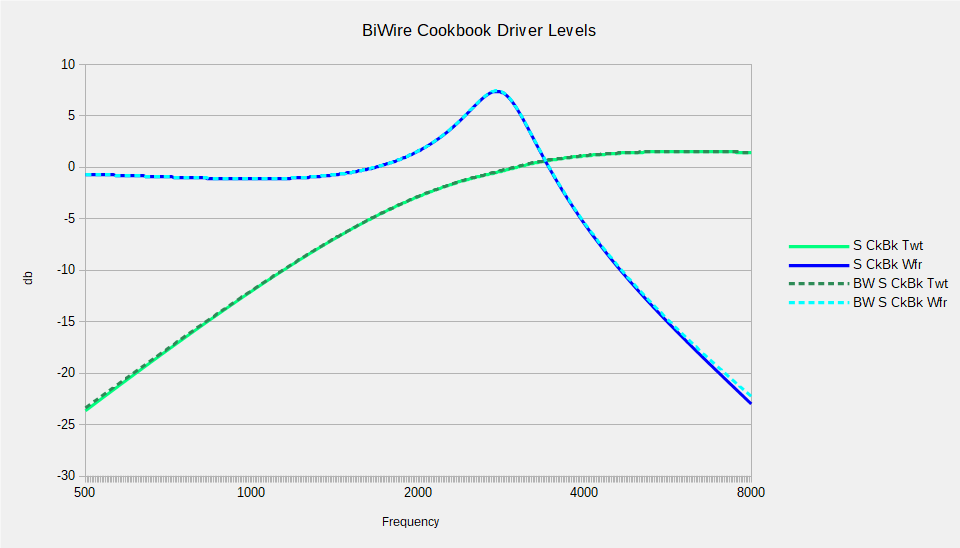
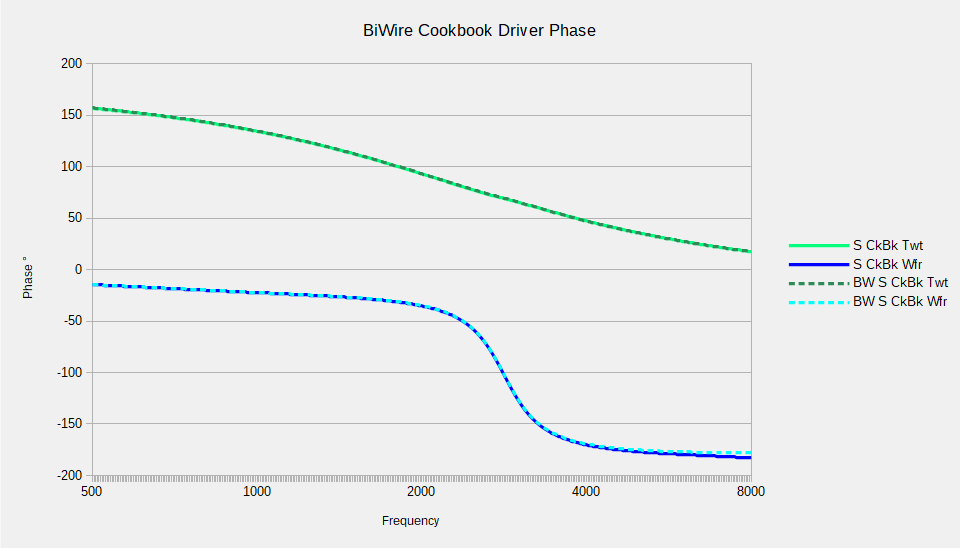
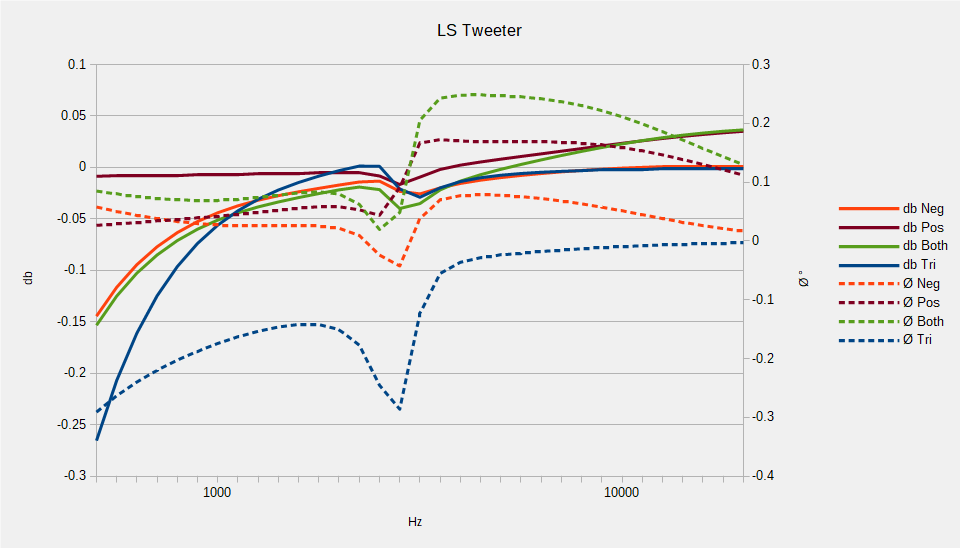
These graphs show the Driver responses measured at the Driver / XOver connection in the loudspeaker at the lines marked Woofer and Tweeter in the model images above. Only the Single wire Cookbook is shown as in all cases responses overlay similarly. This is expected from Y-Axis XOver attenuation magnitudes. Frequency is ±2 octaves from the XOver frequency.
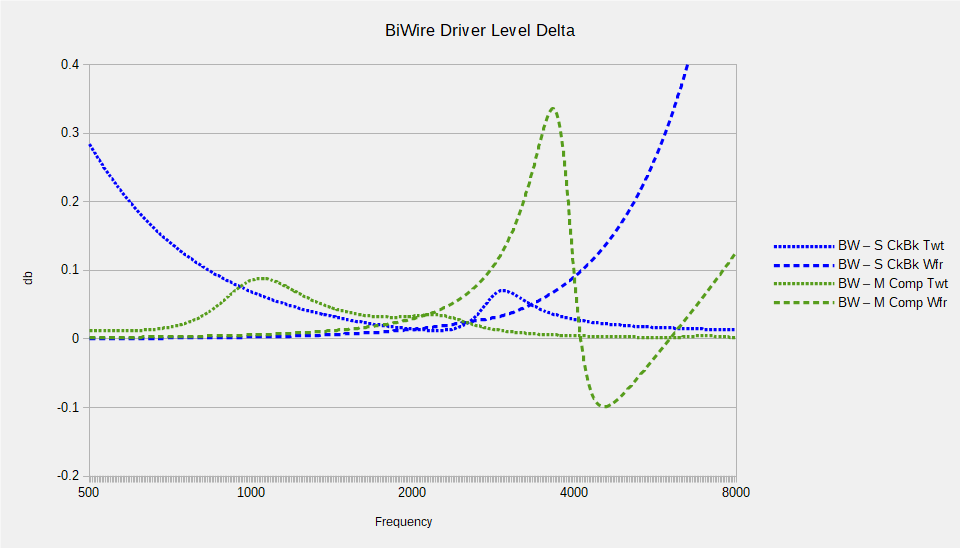
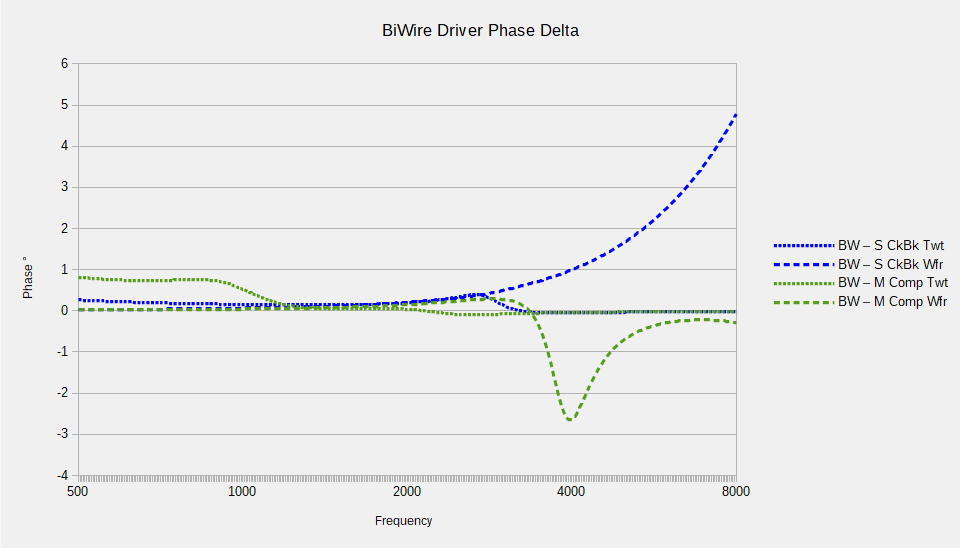
These graphs show the deltas between one cable to the speaker and Bi-Wired with two runs for Single Cookbook and MultiWire Computer models. The single lead is subtracted from the Bi-Wire. The differences are slight, but quite probably within the detectability range of critical listeners. It is interesting to note that more complex MultiWire / Computer
XOver combination has more rapid rates of change, perhaps enhancing detectability.
Bi-Wiring Bridging
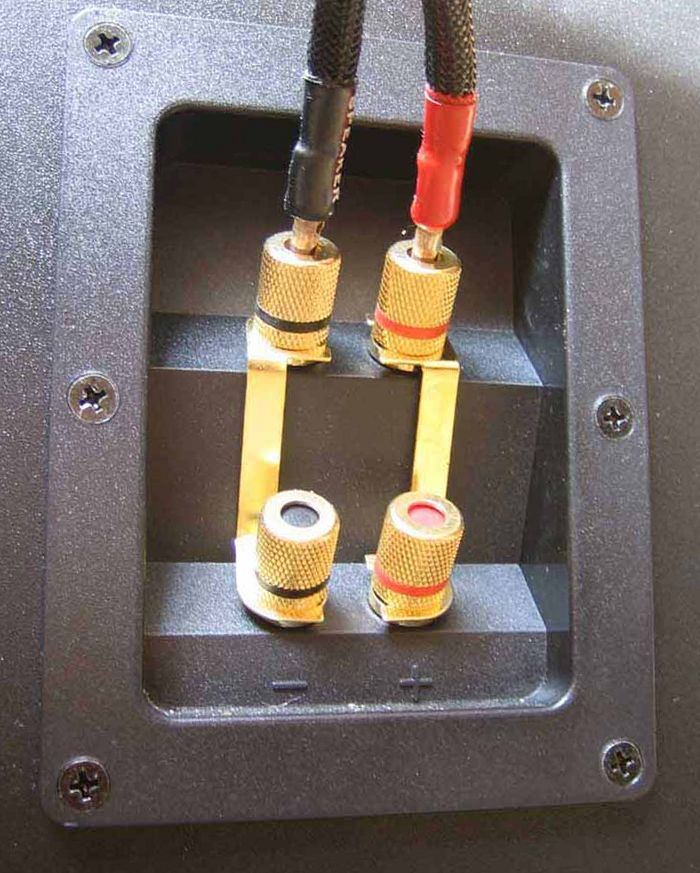
Many Bi-Wire capable loudspeakers are delivered with a pair of Bridges between the Plus and Negative terminal pairs to allow single cable connection. Of course this led to the inevitable 'Which Bi-Wire Bridge Mode Sounds Best?'. There FOUR possible 4 conductor Bi-Wire combinations plus the Tri-Wire variant:
- • None - Normal 4 conductor Bi-Wire
- • Negative - Bridge between Negative terminals only
- • Positive - Bridge between Positive terminals only
- • Both - Negative and Positive terminals bridged BUT with a cable connected to each
- • TriWire - Single conductor to Positive or Negative Bridged terminals and two wires to opposite polarity


The images above are deltas to a standard 4 conductor Bi-Wire. It is readily apparent that each Bridge Mode differs and the magnitudes are system dependent. In short, listen with a jaundiced ear upon all claims and recommendations unless the systems are identical from source onwards.
A/C Wiring
Much ado is made in some circles about the inadequacy of 14ga wiring and how it will diminish dynamics.
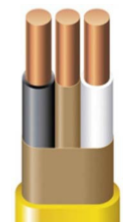
14ga Copper wire has an ampacity of 28 amps. The U.S. National Electrical Code [NEC] rates 14ga THHN for 20A @ 75°C. Romex 14/2 is electrically equivalent to THHN. NEC limits 14ga to 15A circuits for a very adequate safety margin. See NEC 310.15(B)(16).
To find how much loss is incurred on a heavily loaded 14ga circuit, a SemiProfessional espresso machine, plugged into the first socket on a circuit and the only device, was measured. It has a 1600w heating element with a resistance of ≈8.25Ω or ≈14A current draw. The heating element is PID controlled. This duty cycle is a square wave and presents transients far in excess of anything in a HiFi system. Using a digital sampling oscilloscope [DSO], 100%, ≈50% and 0% duty cycle load voltages were recorded.
No load measured 117.81vrms, load 114.02vrms integrating samples over 1 period for periods
with the highest and lowest peaks respectively. Over several minutes, 50% or 100% duty cycle made no difference in the loaded voltage peaks.
Working backwards from measured voltages and load resistance, circuit wiring resistance is ≈0.28Ω. 14ga copper is about 2.25Ω/1000 feet. For two runs, L&N, ≈54 feet. The machine is ≈42 from the panel. Add in 12 feet for up, down & around and surprise, surprise, we have a near perfect match.
So... if we change to 10ga wire, we have ≈0.11Ω for our 54 foot run or ≈0.17Ω lower resistance. This calculates to 116.28v on the load. Relative to the no load 117.81v, this is a ratio of 0.968 to 0.987 for 14ga to 10ga respectively. L&C deltas between Romex 14/2 and 10/2 will be negligible @ 50/60Hz over typical wire runs.
The really bad news: 20 * log ( 0.968 / 0.987 ) = -0.171db! OUCH! For a system drawing 1600w! Less, much, much less, for all but the beefiest amplifiers.
Some prattle on about the mains wire heating. On a 715wpc tri-amped + dual sub system, 12ga wire temperature rises 2.9°C [measured] over about 3 hours playing pop music. Rise would be less for most jazz and classical.
A 20 foot run:
| 12ga | 10ga | |
| ΔT [°C] | 2.9 | 1.8 |
| ΔR [mΩ] | 51 | 20 |
While the deltas in the numbers are large relative to the magnitudes, these are DC values. Power transformer primary inductance makes them irrelevant. A 125w tube amp power transformer has a DC resistance of ≈700mΩ, which would allow a peak current of ≈250A on 120VAC were it not for the inductance.
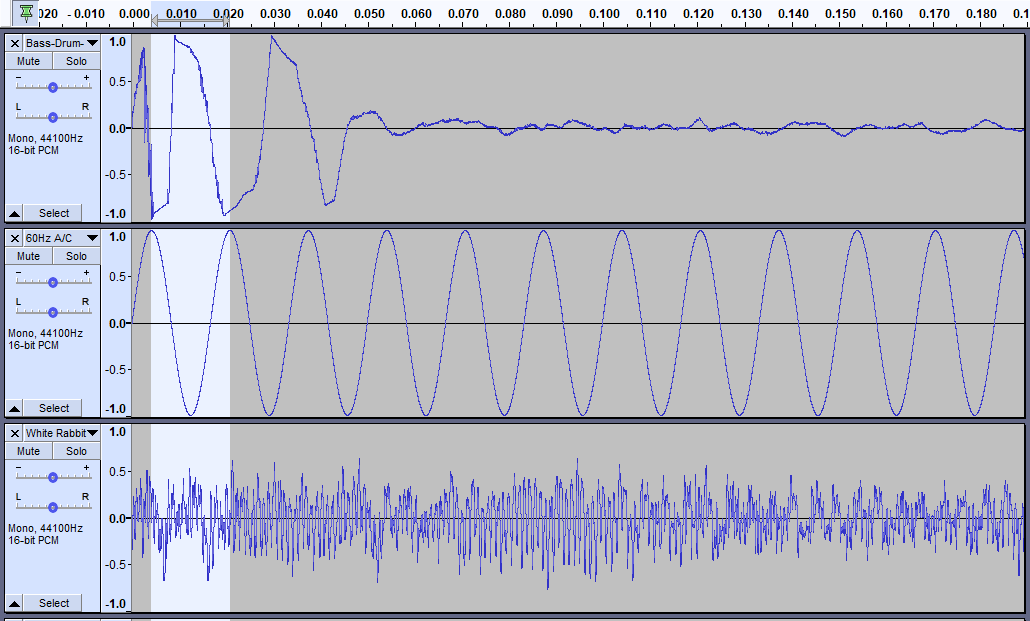
People prattle on about A/C line current draw as though it is continuous. Musical peaks are asynchronous to the line frequency! The image shows 3 samples: Bass Drum, A/C Line Hz and a snippet from Jefferson Airplane's "White Rabbit". In the drum sample, the peak signal is out of phase with the line. All power is supplied from the capacitor filter bank that was charged on the previous half cycle. In the "White Rabbit" snippet, the signal is primarily out of phase with the line. Later, the signal is as much in as out of phase with the A/C.
Tube amplifiers typically have a mono-polar PSU. Hence both halves of the AC sine wave feed the PSU. Just sayin'... 😎
A robust and low impedance power supply is far more critical to good dynamics than AC wire gauge. Sadly, people spend big dollars for wire gauge bragging rights having been taken in by unproven claims. Rod Elliot has a very good article on Power Supplies. Note how little of the AC wave form rectifier diodes actually conduct.
A robust and low impedance power supply is far more critical to good dynamics than AC wire gauge. Sadly, people spend big dollars for wire gauge bragging rights having been taken in by unproven claims. Rod Elliot has a very good article on Power Supplies. Note how little of the AC wave form rectifier diodes actually conduct.
Some maintain that a 20A breaker is required. A Class B resistive breaker has a 3-5x multiple of rated capacity for a couple of seconds. For a 15A breaker that is 45-75A or ≈5000-9000 watts. Voice coils are vapor by the time the breaker trips.
See Understanding Breaker Trip Curves
In all but the beefiest systems, if 20A circuits do anything, dollars to donuts it is due to replacing aged poor quality push terminal sockets with clean robust screw terminals and a direct run. Push terminals can drop 0.5V per and a robust HiFi at the end of a long daisy chain could be compromised.
IMO, there is no need for GFCI in a HiFi as there should be next to no chance of water at the equipment.
Mains Voltage
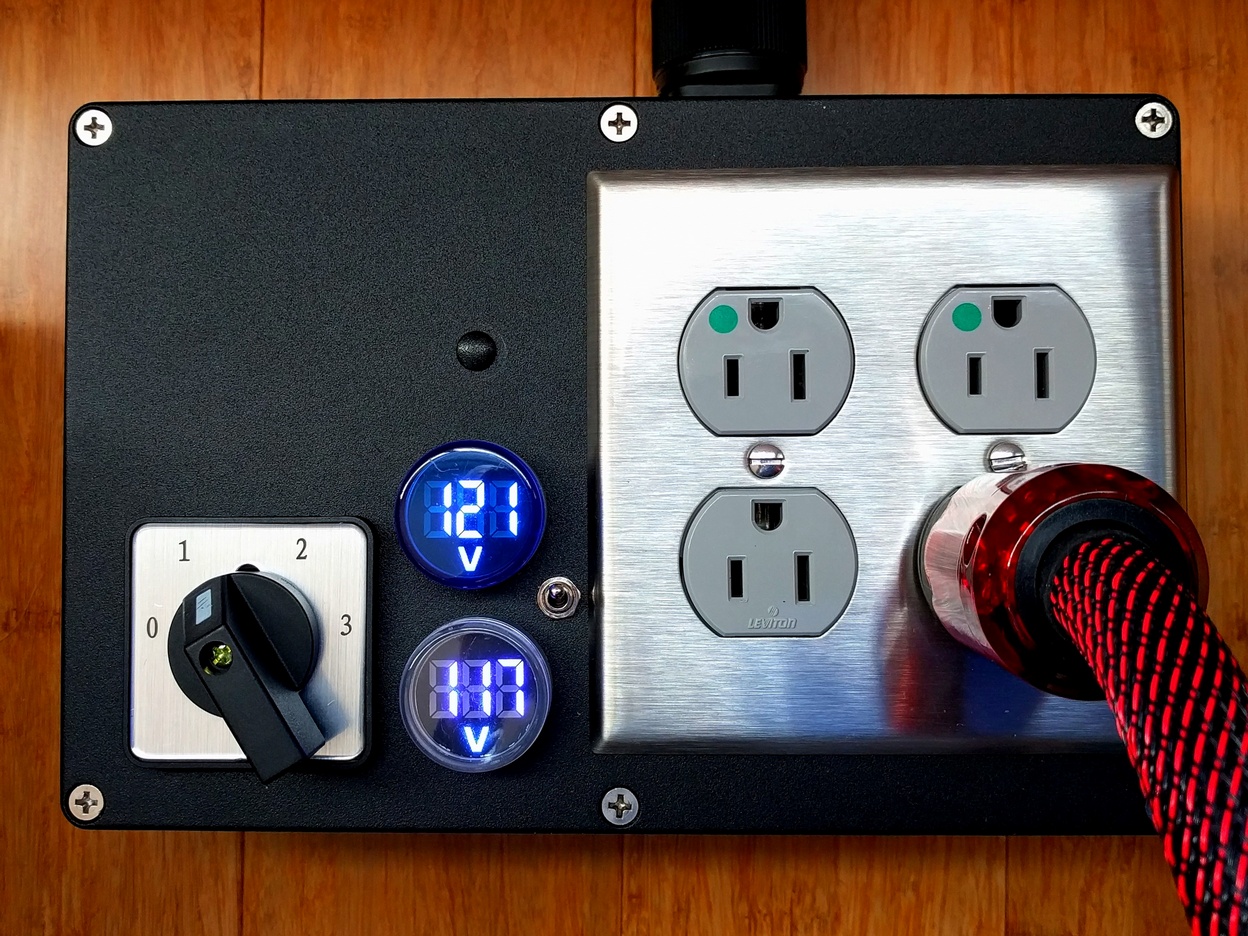
50+ years on since 120V became the U.S. nominal in 1967, line voltages are still all over the map.
Many manufacturers still rate equipment @ 1945 US standard 117V or 115V for the North American market. A 5% overvoltage may be detrimental, particularly with older tube gear. A Bucking Transformer can reduce the voltage and risk.
Many manufacturers still rate equipment @ 1945 US standard 117V or 115V for the North American market. A 5% overvoltage may be detrimental, particularly with older tube gear. A Bucking Transformer can reduce the voltage and risk.
Conclusion
Some claim all cables sound the same. Some claim two cables with the same R will sound the same. Some cable manufacturers make all kinds of wild claims, provide no engineering insight as to problems solved and charge ever increasing prices for something that may not be any better than, or even different from, what the customer is currently using as cables interact with the system! Everything interacts and any claims for guaranteed improvements may be proved ephemera.
Caveat emptor.
Further reading: Speaker Wire A History by Roger Russell.
Makes most of the arguments for 'no difference'. BUT buried within is "However, this was found to be caused by the speaker. " Which is our exactly our point. Audibility is system and listener dependent.
Caveat emptor.
Further reading: Speaker Wire A History by Roger Russell.
Makes most of the arguments for 'no difference'. BUT buried within is "However, this was found to be caused by the speaker. " Which is our exactly our point. Audibility is system and listener dependent.